Start your business with CJdropshipping
All-in-one dropshipping solution provider: product supplies, global logistics, free sourcing, POD, video shooting, and other dropshipping-related services.
CJ Blog
There is a famous saying by French novelist Dumas, “living without an aim is like sailing without a compass”. When it comes to drop shipping or e-commerce, we can easily conclude that a website without analytics is like sailing without a compass.
Data analysis websites are rather practical and useful for website optimization and market research is a very practical tool. Data analysis websites can help you collect, estimate and analyze your website visit records.
Every website developer and owner wants to know the full status and information on their website. There are many analysis websites available at present, and here are the top 8 best data analysis websites with real-time data.
1. Google Analytics
This is the most widely used access analytics website, and a few weeks ago, Google Analytics introduced a new feature that provides a real-time report. You can see how many visitors are currently online on your site, what pages they see, which sites they link to, which countries they come from, and so on.
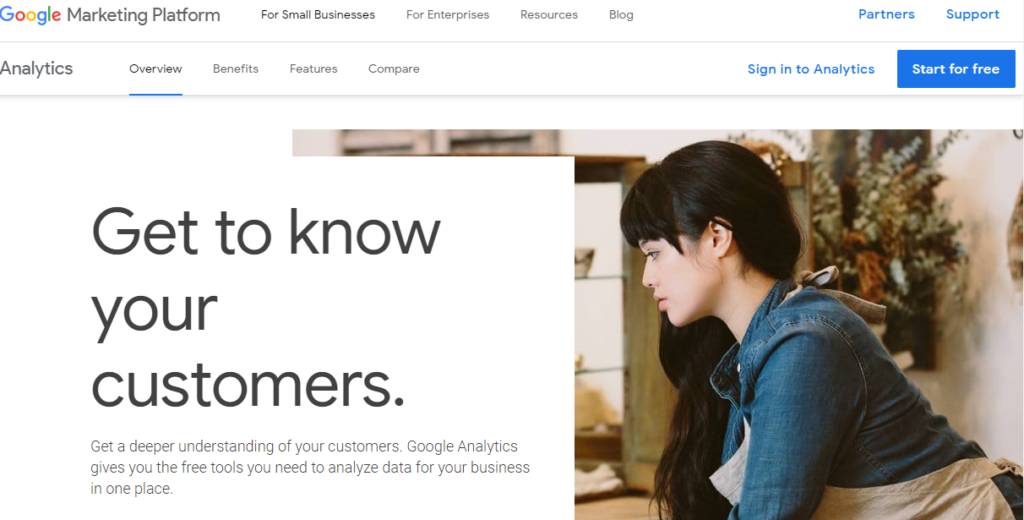
What makes Google Analytics different?
*Get a deeper understanding of your customers. Google Analytics gives you the free tools you need to analyze data for your business in one place.
*Understand your site and app users to better evaluate the performance of your marketing, content, products, and more. Access Google’s unique insights and machine learning capabilities to help get the most out of your data. Analytics is built to work with Google’s advertising and publisher products so you can use your analytics insights to reach the right customers. Process and share your data quickly with an easy-to-use interface and shareable reports.
*Get the most out of your data with features like analytics intelligence, detailed reporting, and so much more.
*Easily access data from other Google solutions while working in Analytics, for a seamless workflow that saves you time and increases efficiency.
*Analytics offers small business and enterprise solutions to help you see what’s working and fix what’s not.
2. Clicky
Clicky is relatively simple and easy compared with Google Analytics that huge analysis system. 1,193,949 web sites depend on Clicky to monitor, analyze, and react to their traffic in real time. There are a series of statistical data to trace on its control panel, including traffic of the recent three days, the highest source of 20 links and 20 keywords. Although they are few data types, Clicky intuitively reflect the current site data, and besides, the UI is concise and fresh.
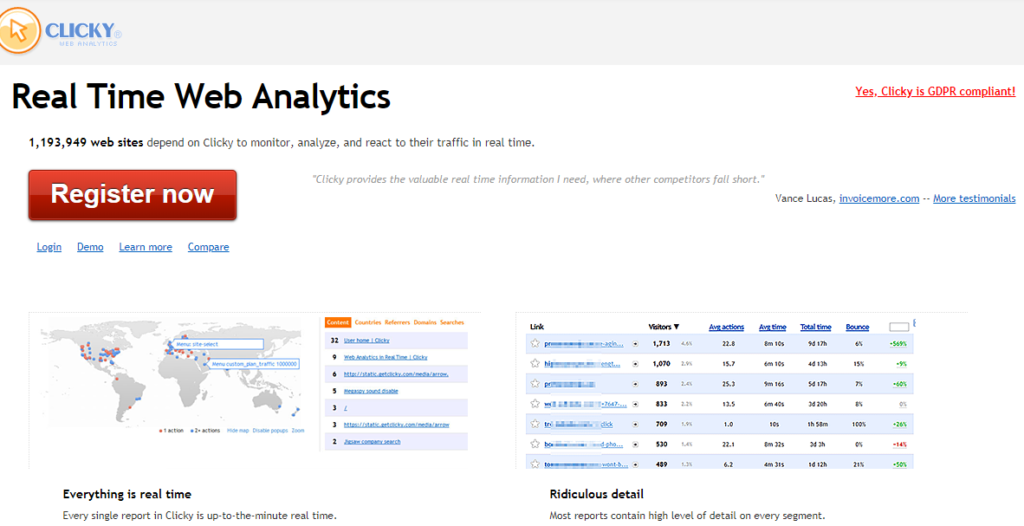
What makes Clicky different?
*Everything is real-time
* High-level detail
*Individual visitors and actions
*No bots or referrer spam
*Heatmaps--View heatmaps by page, visitor, or segment
*On-site analytics
*Uptime monitoring
3. Woopra
Woopra takes real-time statistics to the next level which can live access site data, and you can even chat with users by using Woopra Chat widget. It also has advanced notification features that allow you to create notifications such as emails, sounds, pop-ups, etc.
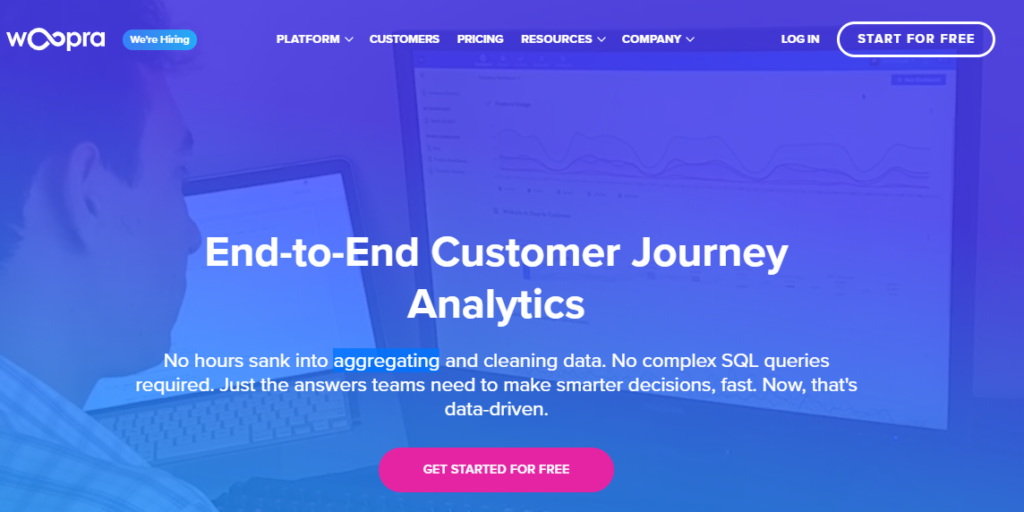
What makes Woopra different?
*Analytics for Product, Marketing, Sales and Support teams.
*Optimize every touchpoint in the customer experience--analytics to answer any *See *Democratize knowledge--every employee should be able to ask any question of their data before making decisions.
*Take real-time action--trigger personalized interactions with built-in automation. *50+ one-click integrations--seamlessly unify data across tools, teams, and touchpoints.
4. Chartbeat
This is a real-time analytics tool for news publishing and other types of websites. Professional analytics for e-commerce sites is coming soon. It allows you to see how visitors interact with your site, which can help you improve your site.
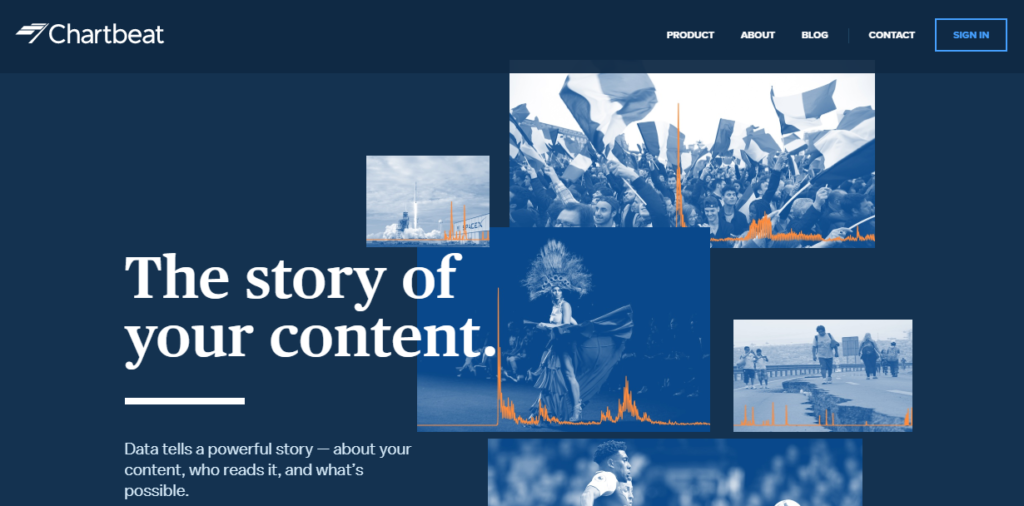
What makes Chartbeat different?
*Dashboards--a window into your readers
See how your audience connects with your content in real time, assess KPIs over the long term, and grasp how your videos capture viewer attention.
*Optimization--tools to adapt and optimize
Adapt user experience and test page elements like headlines within your normal workflow, to know what moves your most valuable audience.
*Reporting--a deeper read
Start each day with the data you need—whether it’s automated insights delivered to you or flexible tools to build more in-depth reports.
5. GoSquared
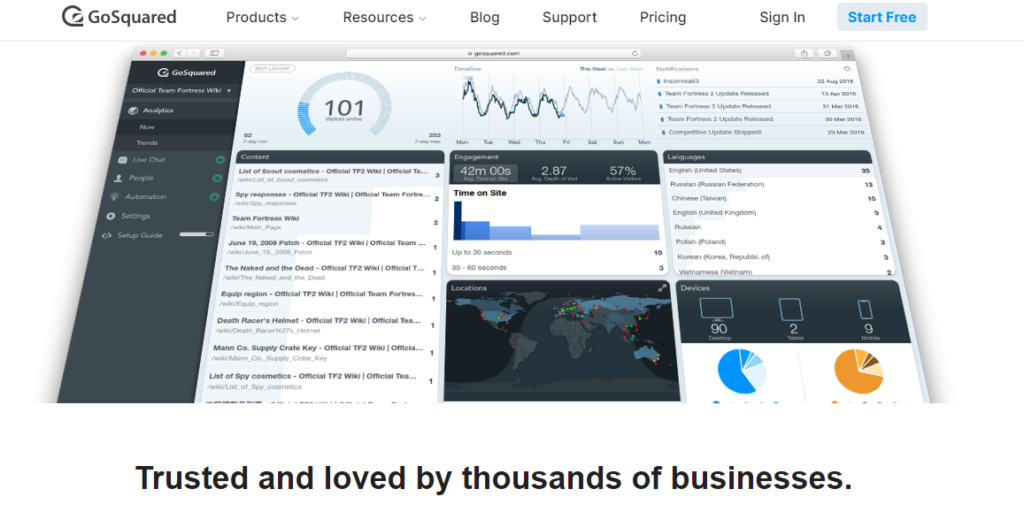
It offers all the usual analytics and lets you view data from specific visitors. It integrates with Olark, allowing you to chat with visitor. GoSquared gives you an all-in-one suite of tools to understand, interact and delight your customers to drive growth at every stage of the lifecycle, it is trusted and loved by thousands of businesses.
What makes GoSquared different?
*Reduce tool fatigue
Consolidate multiple growth tools in one powerful, integrated platform. Manage every customer interaction in one place.
*Perfect for software as a service (SaaS) businesses
Hundreds of features to drive more trial signups, engage and convert users, and delight customers to drive loyalty.
*Huge value, tiny price
Every dollar you spend on tooling is a dollar you can’t spend on growing. That’s why we offer GoSquared at a fair price.
6. Mixpanel
The website allows you access to visitor data and analyzes trends, as well as different data compared with several days ago. Mixpane can analyze user behavior across your sites and apps. Then send messages and run experiments from what you learned. And your business grows by learning why users convert, engage, and retain.

What makes Mixpanel different?
*Collect accurate customer and product data in real-time across mobile, web, and other platforms.
*Define key business metrics and see how they tread over time, identify all the platform that matters to your business.
*Understand why those treads are happening, find out why users will likely engage, retain, and convert.
*Set goals to improve the trends, then create informed hypotheses on how to reach those goals.
*Tie your hypotheses back to business metrics like conversion, engagement, and retention.
7. Piwk
Piwk is a real-time analytics tool that you can easily download and install on your own server. AdTech and MarTech experts founded Piwik PRO in 2013 due to the lack of an analytics stack that was both high performance and privacy-friendly. Their suite of products marries privacy by design, flexible hosting and full data ownership with enterprise-level features and support.
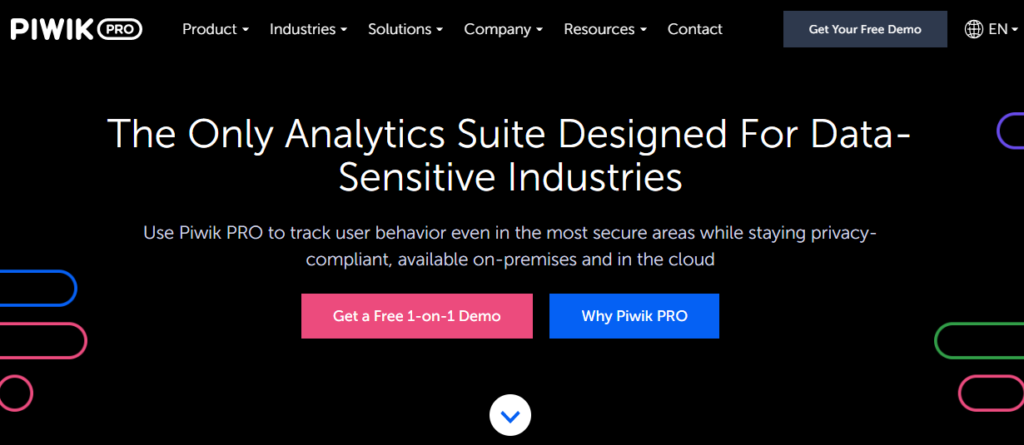
There are eight categories of Piwk, including web analytics, sharepoint analytics, tag manager, GDPR consent manager, mobile app analytics, custom reports, customer data platform and on-site retargeting.
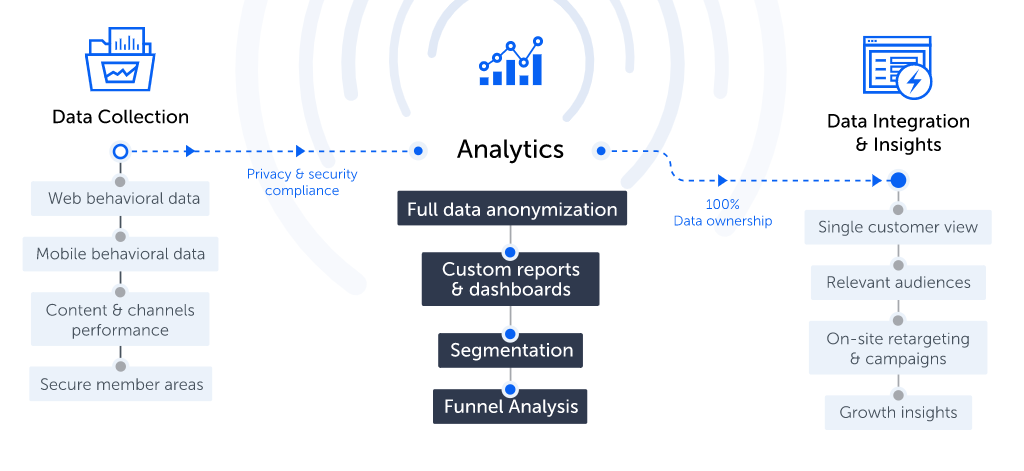
Here is a simple process of data analytics:
8. ShinyStat
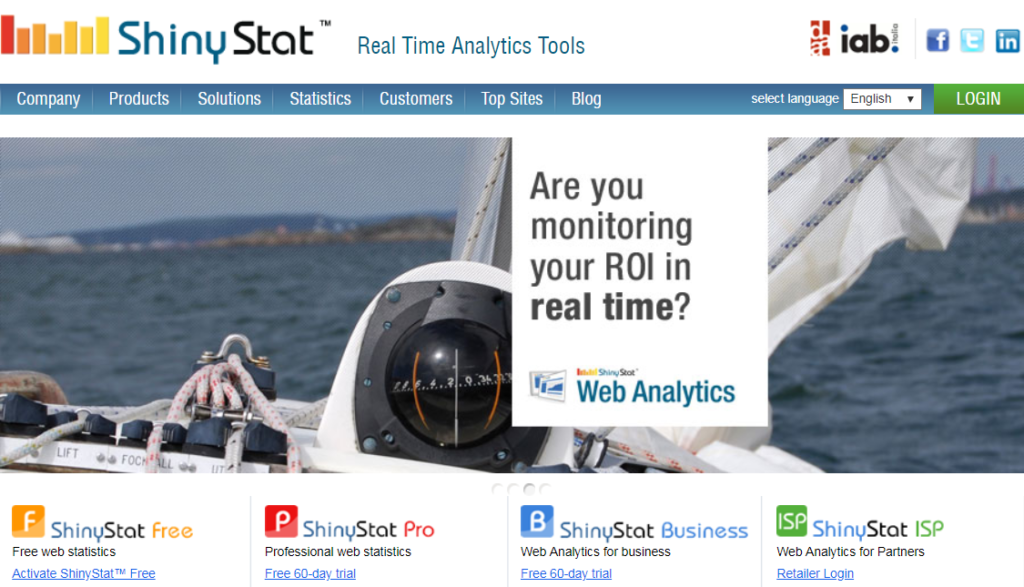
ShinyStat is a browser-based web analytics platform which allows you to measure the traffic of your Web site in real time. The site offers four products, including ShinyStat Free, ShintStat Pro, ShinyStar Business and ShinyStat ISP. ShinyStat Free is a limited free analytics product available for both individual and nonprofit sites. The business edition has search engine ranking detection that helps you track and improve your site’s ranking.
What makes ShinyStat different?
*The experience gained over the years means the system stands out from the rest in terms of efficiency and functionality in tracking internet access.
*The platform is able to process and display data in real time, making ShinyStat the ideal partner for companies that need to rapidly analyze the results of their digital marketing investment.
*For investors in web marketing, ShinyStat offers a range of tools to measure and optimize returns on investment.
Chat
Share